import pandas as pd
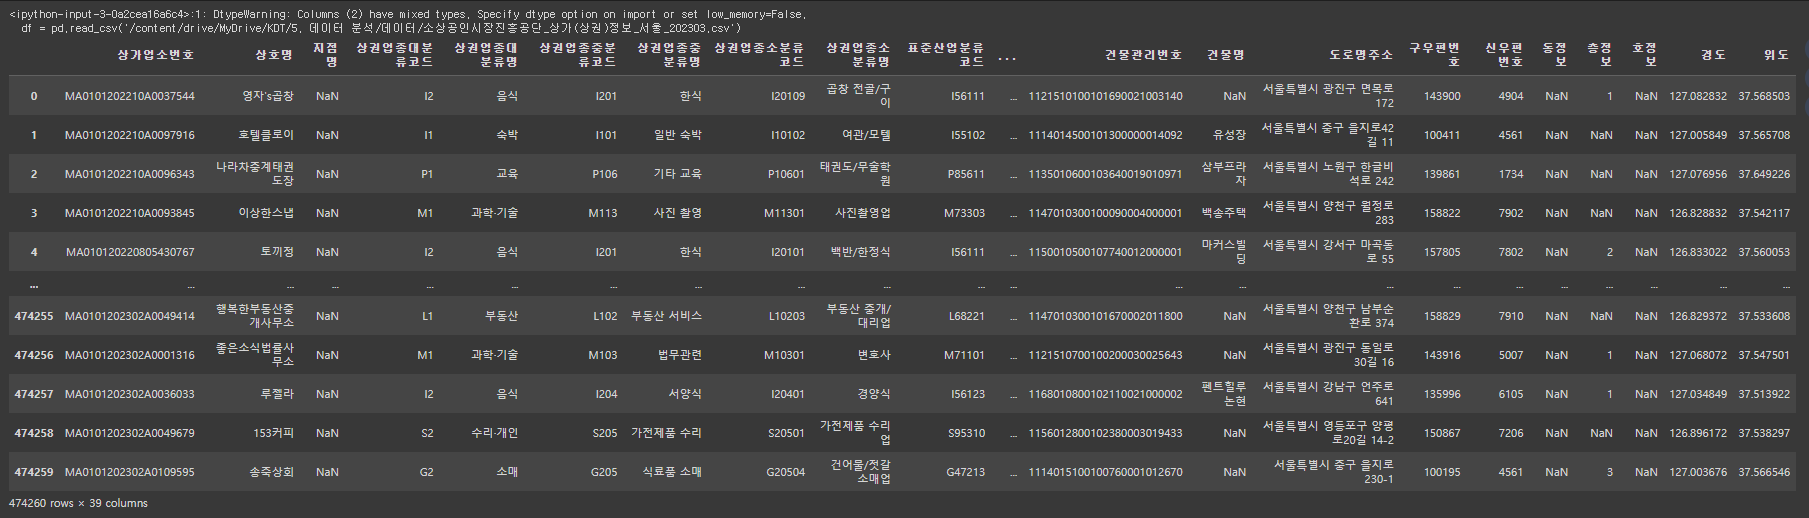
df = pd.read_csv('/content/drive/MyDrive/KDT/5. 데이터 분석/데이터/소상공인시장진흥공단_상가(상권)정보_서울_202303.csv')
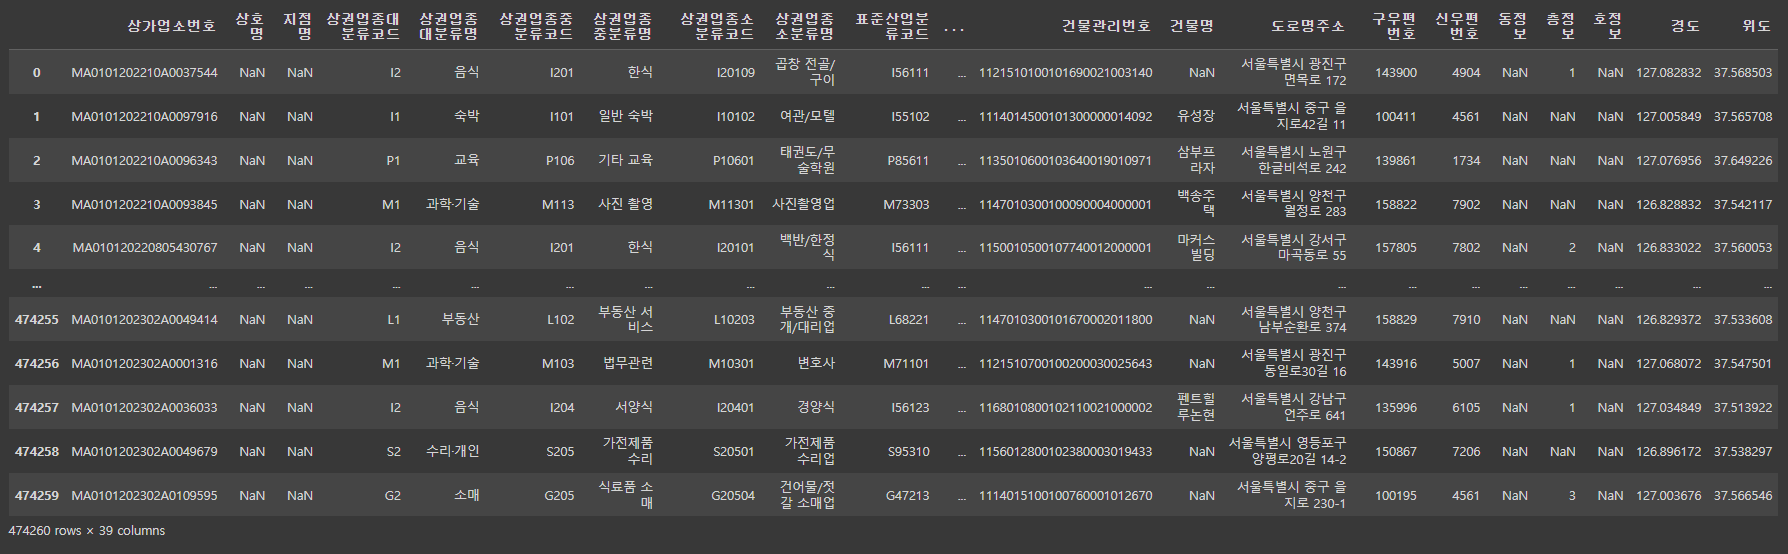
df
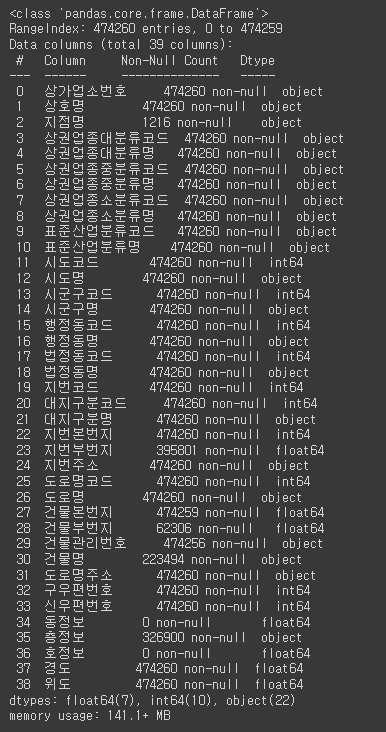
df.info()
shop = ['엽기떡볶이', '죠스떡볶이', '신전떡볶이', '청년다방', '감탄떡볶이']
# 파리바게트(파리바게뜨) 데이터 필더링
# contains(): 특정 문자열 포함 여부에 따라 True, False를 반환
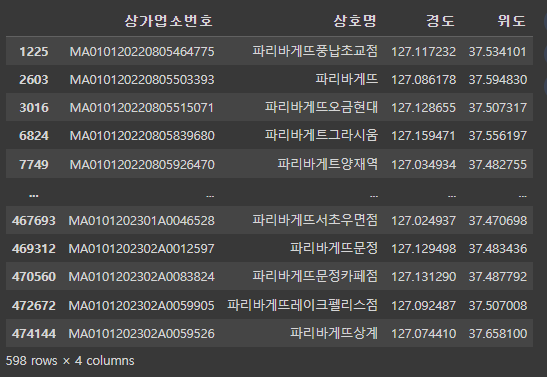
data = df['상호명'].str.contains('파리바게트|파리바게뜨')
df_paris = df.loc[data, ['상가업소번호', '상호명', '경도', '위도']].copy()
df_paris
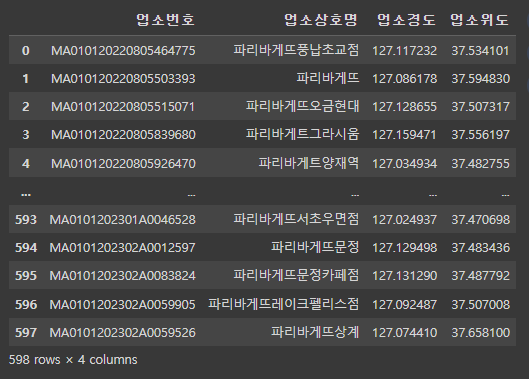
df_paris = df_paris.set_axis(['업소번호','업소상호명','업소경도','업소위도'],axis=1).reset_index(drop=True)
df_paris
# 떡볶이 프랜차이즈 데이터 필터링
df_shop = df.copy()
# 상가업소번호, 상호명, 시군구명, 경도, 위도
# extract() : 특정문자열을 포함하고 있으면 그 문자열을 반환하고, 포함하지 않으면 NaN을 반환
# df_shop['상호명'] = df_shop['상호명'].str.extract('({})'.format('|'.json(shop)))
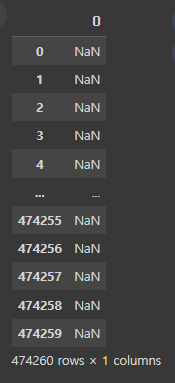
df_shop['상호명'].str.extract('({})'.format('|'.join(shop)))
# 떡볶이 프랜차이즈 데이터 필터링
df_shop = df.copy()
# 상가업소번호, 상호명, 시군구명, 경도, 위도
# extract(): 특정 문자열을 포함하고 있으면 그 문자열을 반환하고, 포함하지 않으면 NaN 반환
# '엽기떡볶이|죠스떡볶이|신전떡볶이|청년다방|감탄떡볶이'
df_shop['상호명'] = df_shop['상호명'] = df_shop['상호명'].str.extract('({})'.format('|'.join(shop)))[0]
df_shop # 떢복이 남겨지고 나머지 NaN
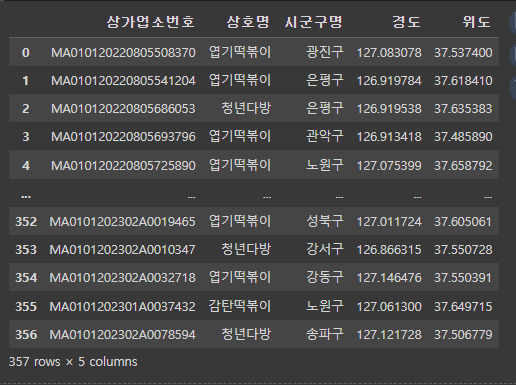
df_shop = df_shop.dropna(subset=['상호명']).iloc[:, [0, 1, 14, 37, 38]].reset_index(drop=True)
df_shop
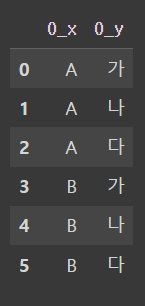
# 곱집합
df1 = pd.DataFrame(['A', 'B'])
df2 = pd.DataFrame(['가', '나', '다'])
df1.merge(df2, how='cross')
# 하버사인 공식
# 두 지점의 위도와 경도를 입력하면 거리를 구해주는 모듈
!pip install haversine

from haversine import haversine
seoul = [37.541, 126.986]
paris = [48.8567, 2.3508]
print(haversine(seoul, paris, unit='km'))
print(haversine(seoul, paris, unit='m')) # 1000차이

df_shop.shape

df_paris.shape

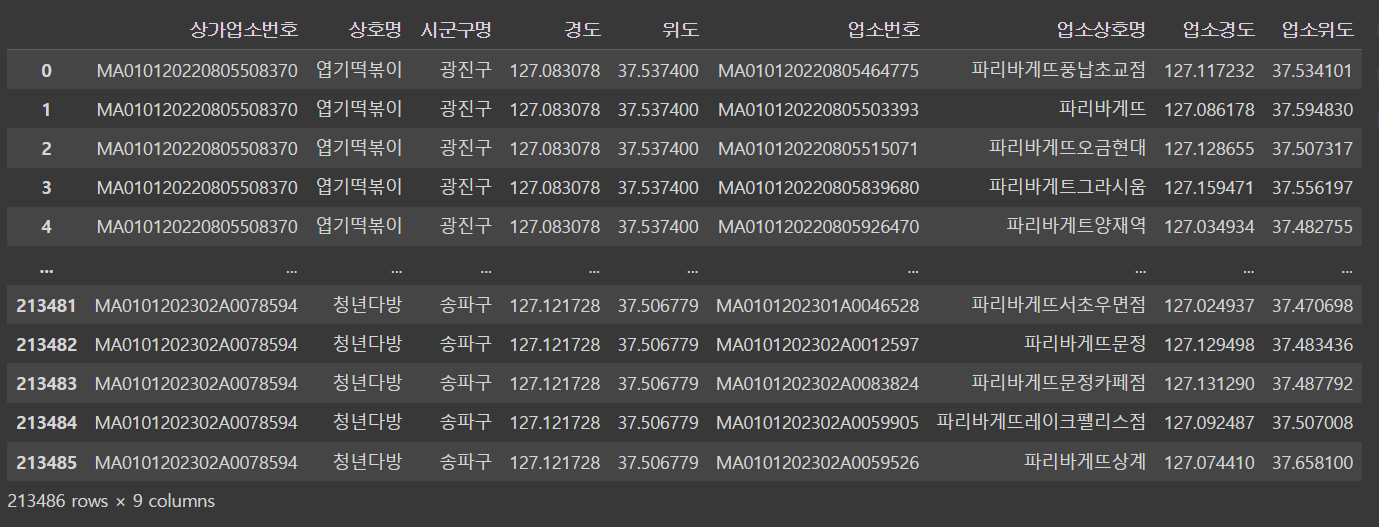
df_cross = df_shop.merge(df_paris, how='cross')
df_cross
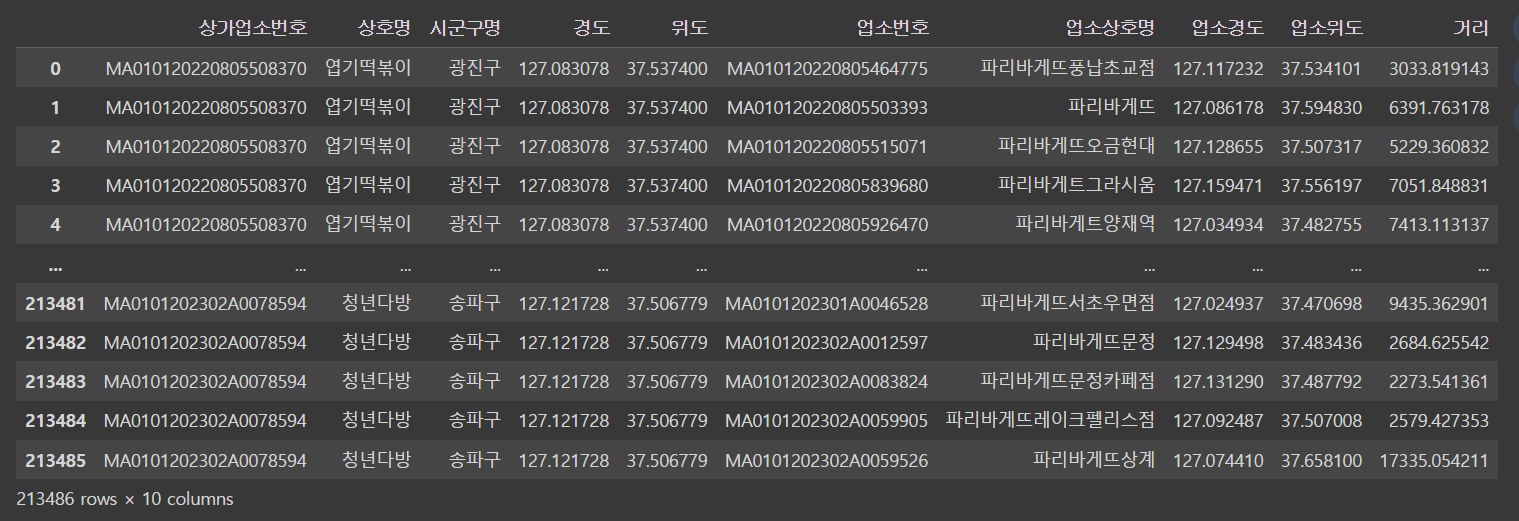
df_cross['거리'] = df_cross.apply(lambda x: haversine([x['위도'], x['경도']], [x['업소위도'], x['업소경도']], unit='m'), axis=1)
df_cross
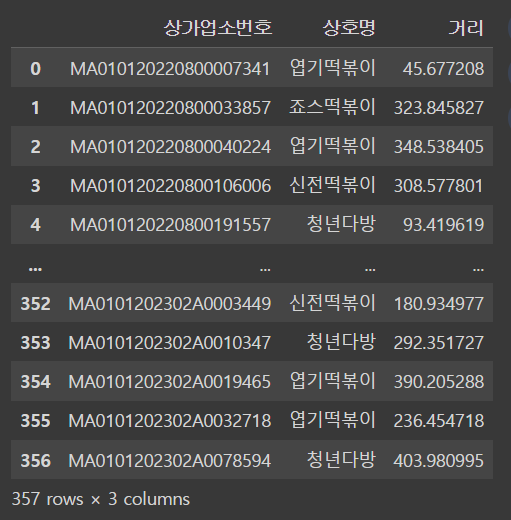
# 개별 떡볶이 매장과 파리바게트와의 최소 거리
df_dis = df_cross.groupby(['상가업소번호', '상호명'])['거리'].min().reset_index()
df_dis
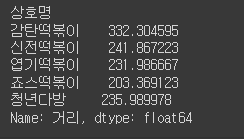
# 각 프렌차이즈 별 파리바게트와릐 평균 거리
df_dis.groupby('상호명')['거리'].mean()
# agg(): 다중집계작업을 간단하게 해주는 함수
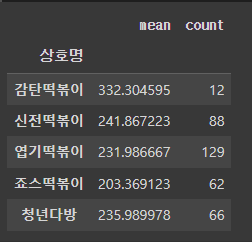
df_dis.groupby(['상호명'])['거리'].agg(['mean', 'count'])
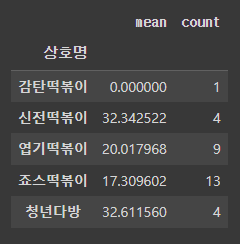
# 거리를 입력하면 프랜차이즈 별 파리바게트와의 평균거리와 매장개수를 출력하는 함수
def distance(x):
dis = df_dis['거리'] <= x
return df_dis[dis].groupby(['상호명'])['거리'].agg(['mean', 'count'])
distance(50)
!pip install pandasecharts
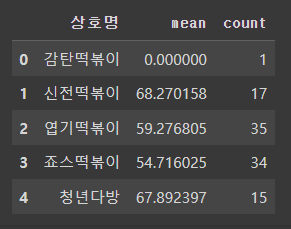
df_100 = distance(100).reset_index()
df_100
import IPython
from pandasecharts import echart
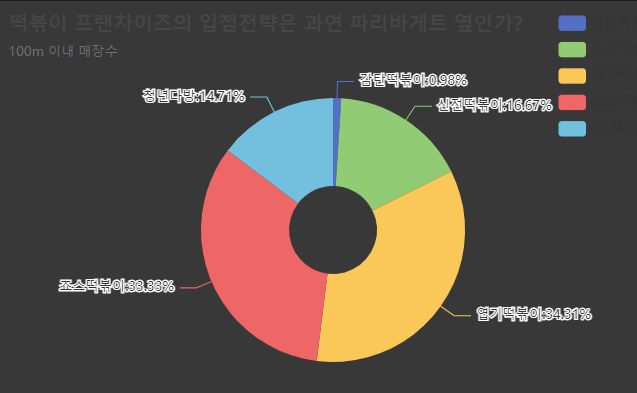
df_100.echart.pie(x='상호명',y='count',figsize=(600,400),
radius=['20%','60%'],label_opts={'position':'outer'},
title='떡볶이 프랜차이즈의 입점전략은 과연 파리바게트 옆인가?',
legend_opts={'pos_right':'0%','orient':'vertical'},
subtitle='100m 이내 매장수').render()
IPython.display.HTML(filename='render.html')
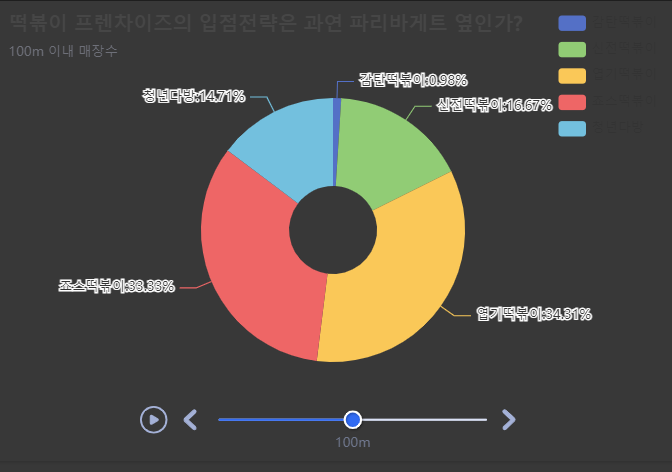
from pyecharts.charts import Timeline, Grid
tl = Timeline({'width': '600px', 'height': '400px'})
pie1 =df_100.echart.pie(x='상호명', y='count', figsize=(600, 400),
radius=['20%', '60%'], label_opts={'position':'outer'},
title='떡볶이 프렌차이즈의 입점전략은 과연 파리바게트 옆인가?',
legend_opts={'pos_right':'0%', 'orient':'vertical'},
subtitle='100m 이내 매장수')
tl.add(pie1, '100m').render()
IPython.display.HTML(filename='render.html')
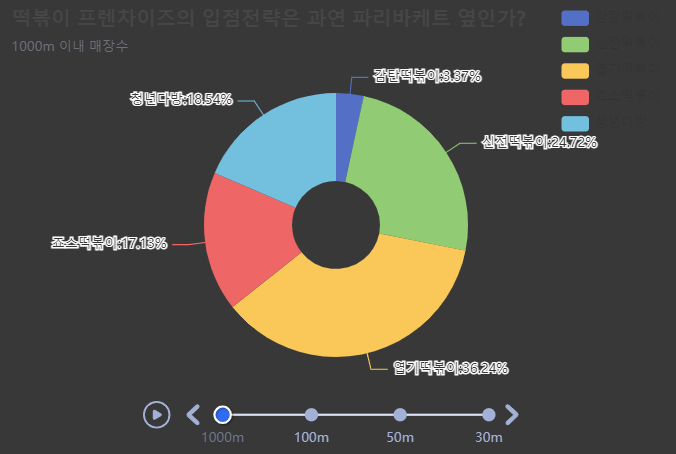
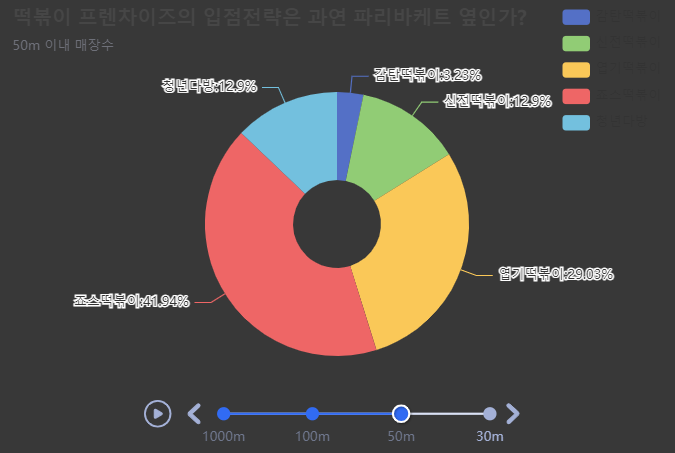
tl = Timeline({'width':'600px', 'height':'400px'})
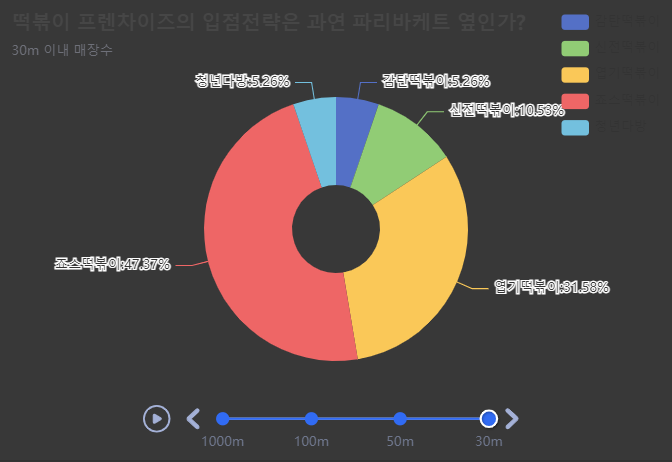
for i in [1000, 100, 50, 30]:
df_d = distance(i).reset_index()
pie1 = df_d.echart.pie(x='상호명', y='count', figsize=(600, 400),
radius=['20%', '60%'], label_opts={'position':'outer'},
title='떡볶이 프렌차이즈의 입점전략은 과연 파리바케트 옆인가?',
legend_opts={'pos_right':'0%', 'orient':'vertical'},
subtitle='{}m 이내 매장수'.format(i))
tl.add(pie1, '{}m'.format(i)).render()
IPython.display.HTML(filename='render.html')

'Python > 데이터분석' 카테고리의 다른 글
| 2024-06-03 7. 서울시 따릉이 API 활용 (0) | 2024.06.03 |
|---|---|
| 2024-05-28 6. 전국 도시공원 데이터 (0) | 2024.05.30 |
| 2024-05-28 상권별 업종 밀집 통계 데이터 (0) | 2024.05.30 |
| 2024-05-27 가상 온라인 쇼핑몰 데이터 (0) | 2024.05.27 |
| 2024-05-27 Matplotlib (0) | 2024.05.27 |