import requests
import folium
import json
import pandas as pd
import warnings
warnings.filterwarnings('ignore')
1-1. 데이터 요청하기
request = requests.post(targetSite, data={'stationGrpSeq':'ALL'})
print(request)
# print(request.text)

1-2. json 데이터 처리하기
- json.loads(): json 타입의 문자열 데이터를 파이썬에서 처리할 수 있도록 변환(딕셔너리로 변환)
bike_json = json.loads(request.text)
# print(bike_json)
print(type(bike_json))

1-3. 딕셔너리 타입의 데이터를 데이터프레임으로 변환하기
- json_nomalize(): 딕셔너리의 타입의 데이터를 판다스 데이터프레임으로 변환
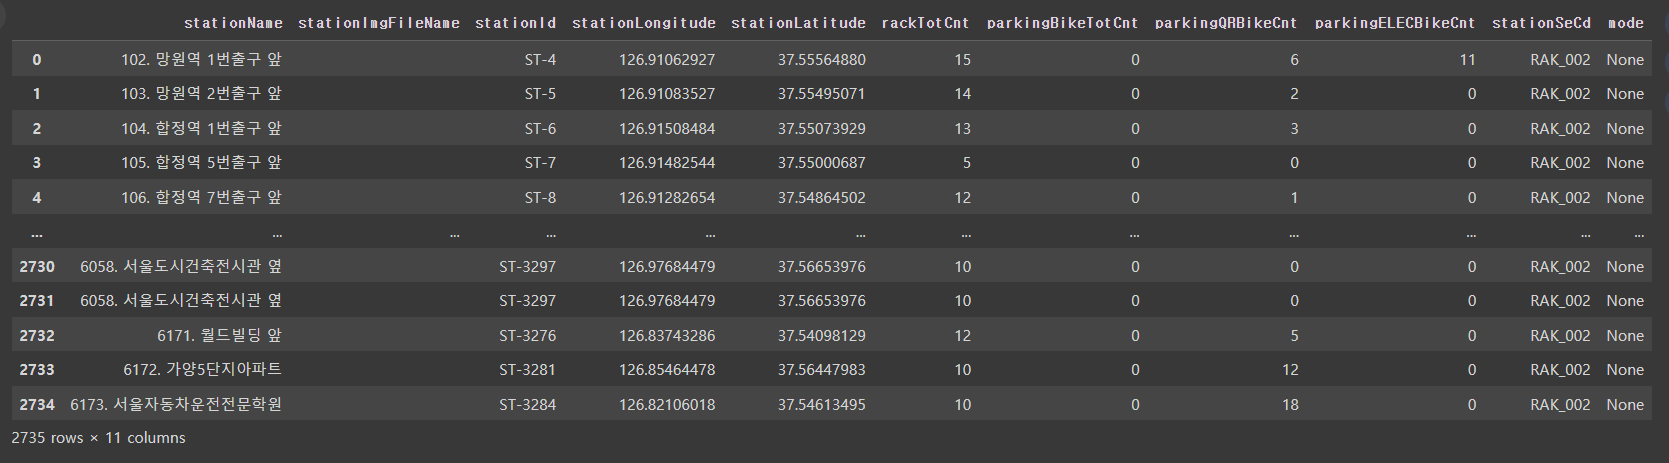
bike_df = pd.json_normalize(bike_json, 'realtimeList')
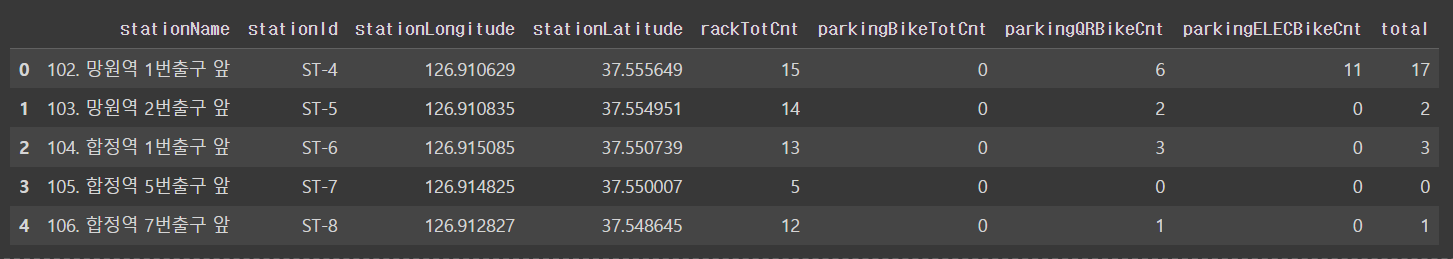
bike_df
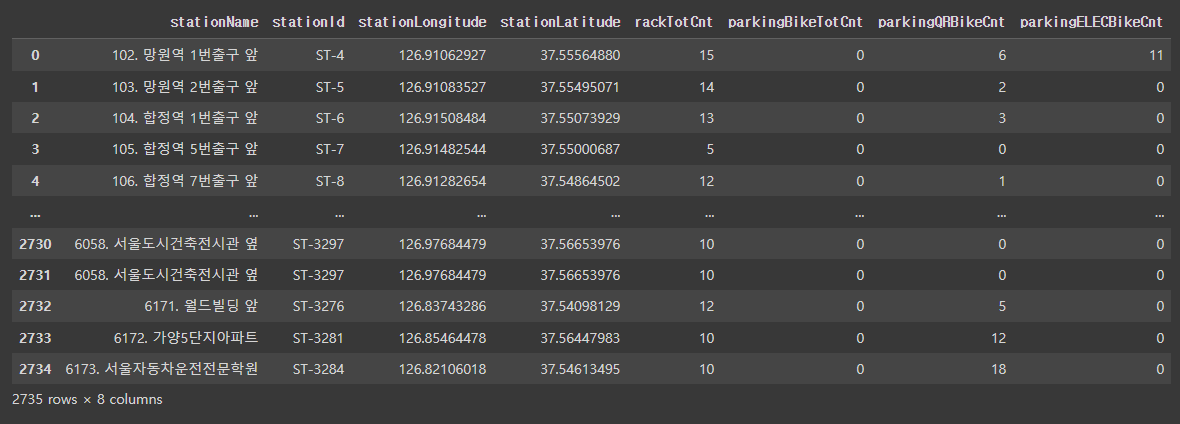
bike_df.columns
- stationName: 대여소 이름
- stationId: 고유한 대여소 번호
- stationLongitude: 대여소 경도
- stationLatitude: 대여소 위도
- rackTotCnt: 주차 가능한 전체 자전거 대수
- parkingBikeTotCnt: 주차된 따릉이 총 대수
- parkingQRBikeCnt: 주차된 따릉이 QR형 총 대수
- parkingELECBikeCnt: 주차된 새싹 따릉이 총 대수
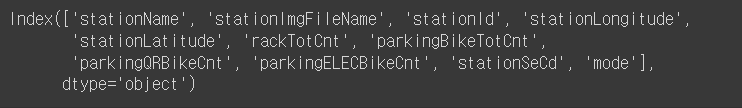
bike_df_map = bike_df[['stationName', 'stationId', 'stationLongitude', 'stationLatitude',
'rackTotCnt', 'parkingBikeTotCnt', 'parkingQRBikeCnt', 'parkingELECBikeCnt']]
bike_df_map
# 문제
# 위도, 경도 -> float 변환
# 주차할 수 있는 자전거 대수, 주차된 자전거 총 대수, 주차된 QR자전거 총 대수, 주차된 새싹 자전거 총 대수 -> int
# 파생변수 만들기[total]
# 따릉이 + QR + 새싹
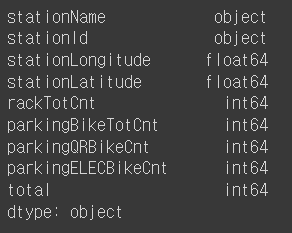
# 위도, 경도 -> float 변환
bike_df_map['stationLongitude'] = bike_df_map['stationLongitude'].astype(float)
bike_df_map['stationLatitude'] = bike_df_map['stationLatitude'].astype(float)
# 주차할 수 있는 자전거 대수, 주차된 자전거 총 대수, 주차된 QR자전거 총 대수, 주차된 새싹 자전거 총 대수 -> int
bike_df_map['rackTotCnt'] = bike_df_map['rackTotCnt'].astype(int)
bike_df_map['parkingBikeTotCnt'] = bike_df_map['parkingBikeTotCnt'].astype(int)
bike_df_map['parkingQRBikeCnt'] = bike_df_map['parkingQRBikeCnt'].astype(int)
bike_df_map['parkingELECBikeCnt'] = bike_df_map['parkingELECBikeCnt'].astype(int)
# 파생변수 만들기[total]
# 따릉이 + QR + 새싹
bike_df_map['total'] = bike_df_map['parkingBikeTotCnt'] + bike_df_map['parkingQRBikeCnt'] + bike_df_map['parkingELECBikeCnt']
bike_df_map.dtypes
bike_df_map.head()
bike_df_map.shape

# {정류소명} 일반:{}대, QR:{}대, 총:{}대
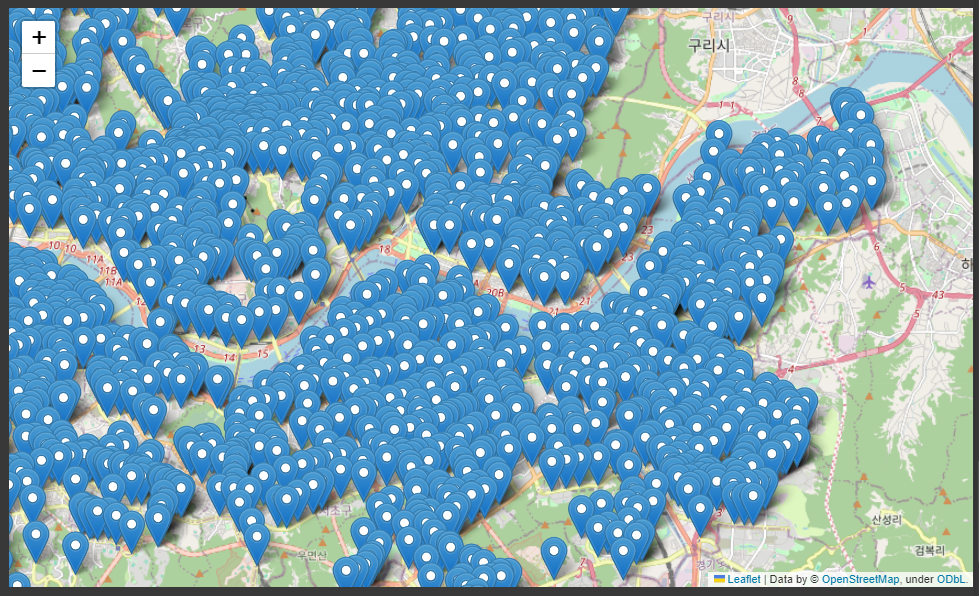
bike_map = folium.Map(location=[bike_df_map['stationLatitude'].mean(),
bike_df_map['stationLongitude'].mean()],
zoom_start=12)
for index, data in bike_df_map.iterrows():
popup_str = '{} 일반:{}대, QR:{}대, 새싹:{}대, 총:{}대'.format(
data['stationName'], data['parkingBikeTotCnt'], data['parkingQRBikeCnt'],
data['parkingELECBikeCnt'], data['total']
)
popup = folium.Popup(popup_str, max_width=600)
folium.Marker(location=[data['stationLatitude'], data['stationLongitude']],
popup=popup).add_to(bike_map)
bike_map
'Python > 데이터분석' 카테고리의 다른 글
| 2024-06-03 8. 떡볶이 프렌차이즈의 입점전략 (1) | 2024.06.03 |
|---|---|
| 2024-05-28 6. 전국 도시공원 데이터 (0) | 2024.05.30 |
| 2024-05-28 상권별 업종 밀집 통계 데이터 (0) | 2024.05.30 |
| 2024-05-27 가상 온라인 쇼핑몰 데이터 (0) | 2024.05.27 |
| 2024-05-27 Matplotlib (0) | 2024.05.27 |