import pandas as pd
retail = pd.read_csv('/content/drive/MyDrive/KDT/5. 데이터 분석/데이터/OnlineRetail.csv')
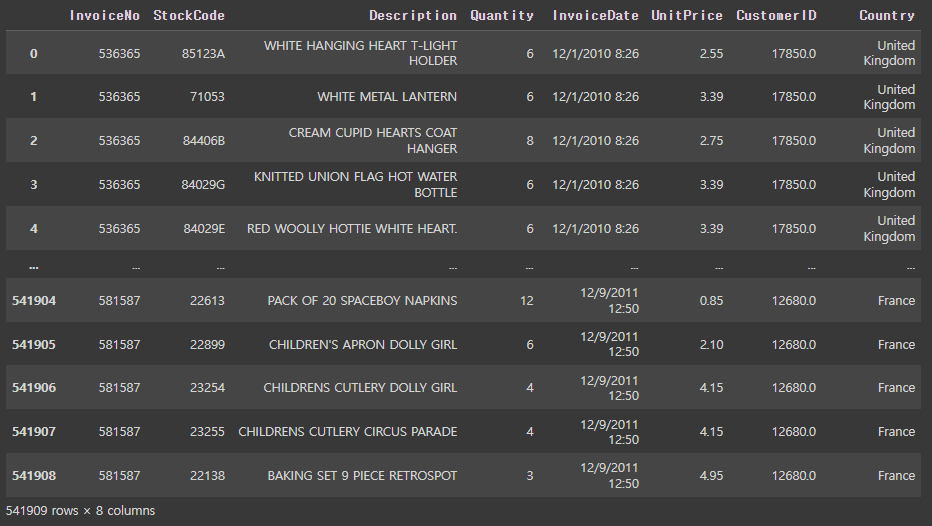
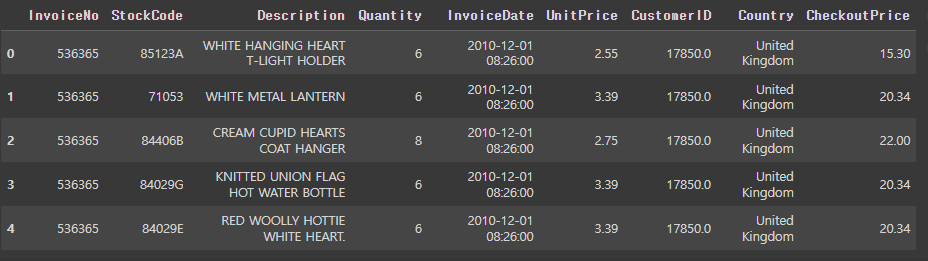
retail
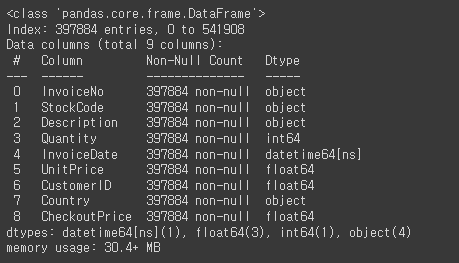
retail.info()
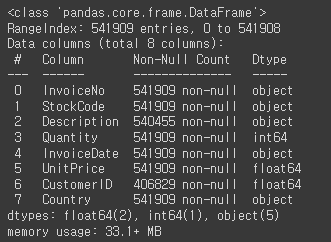
컬럼
- InvoiceNo: 주문 번호
- StockCode: 상품 코드
- Description: 상품 설명
- Quantity: 주문 수량
- InvoiceDate: 주문 날짜
- UnitPrice: 상품 가격
- InvoiceDate: 고객 아이디
- Country: 고객 거주지역(국가)
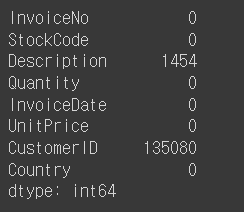
# 각 컬럼당 null이 몇 개 있는지 확인
retail.isnull().sum()
# 비회원/탈퇴/휴면회원 제거
retail = retail[pd.notnull(retail['CustomerID'])]
retail

len(retail)

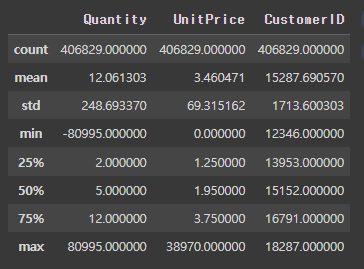
retail.describe()
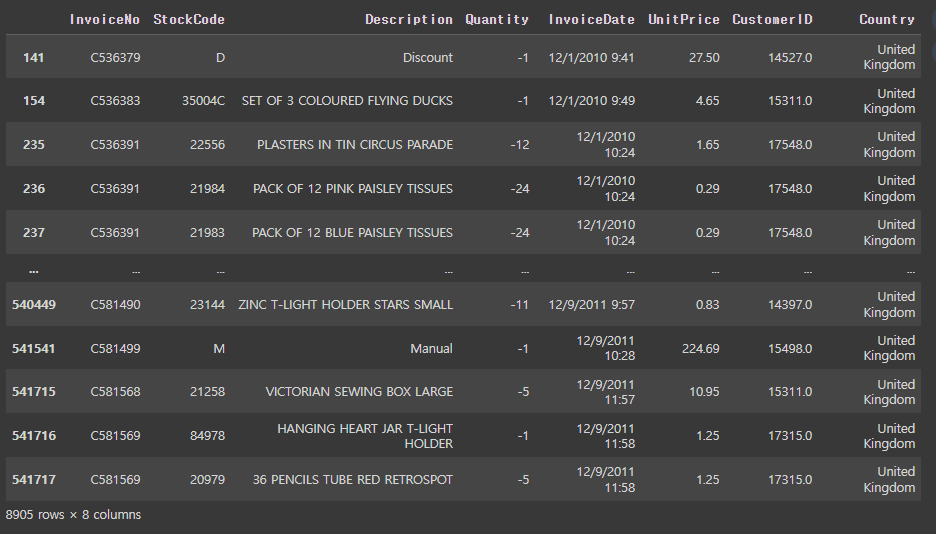
# 구입 수량이 0 또는 0이하인 데이터를 확인
retail[retail['Quantity'] <= 0]
# 구입 수량이 1이상인 데이터만 저장
retail = retail[retail['Quantity'] >= 1]
len(retail)

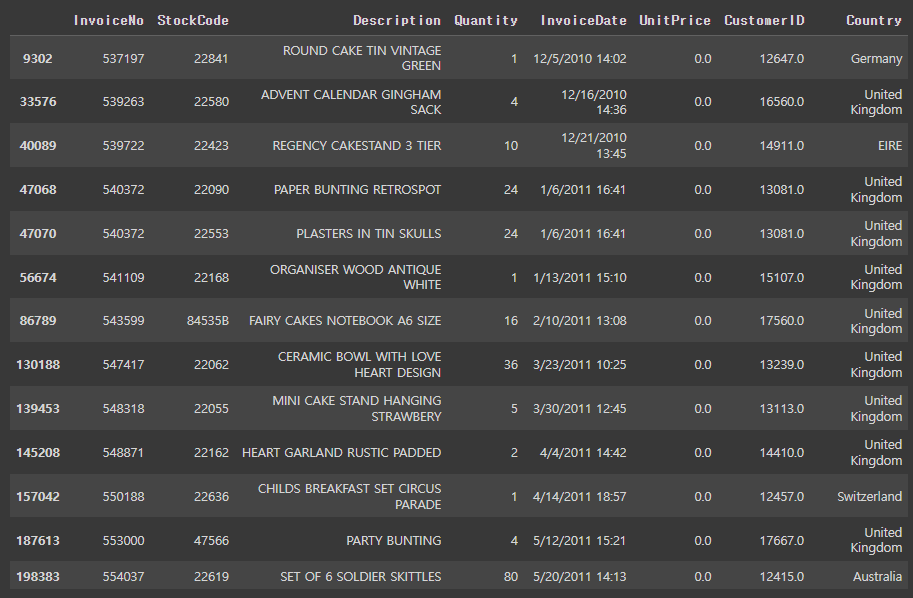
# 구입 가격이 0 또는 0이하인 데이터를 확인
retail[retail['UnitPrice'] <=0]
# 구입 가격이 0초과인 데이터만 저장
retail = retail[retail['UnitPrice'] >0]
len(retail)

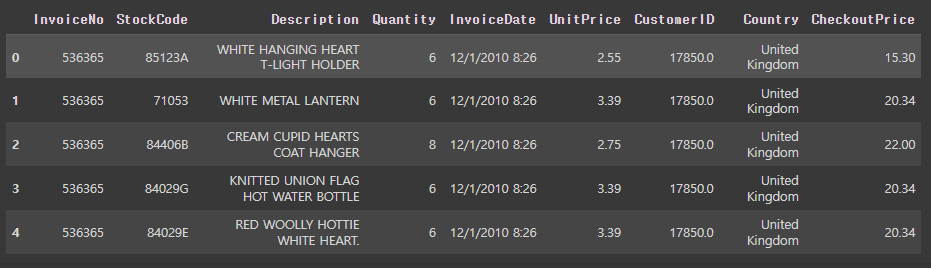
# 고객의 총 지출비용 파생변수 만들기
# 총 지출비용(CheckoutPrice) = 가격(UnitPrice) * 수량(Qunatity)
retail['CheckoutPrice'] = retail['UnitPrice'] * retail['Quantity']
retail.head()
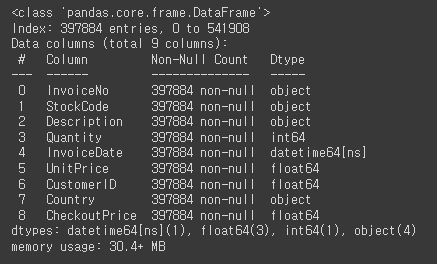
retail.info()
retail.head()
retail['InvoiceDate'] = pd.to_datetime(retail['InvoiceDate'])
retail.info()
# 전체 매출
total_revenue = retail['CheckoutPrice'].sum()
total_revenue

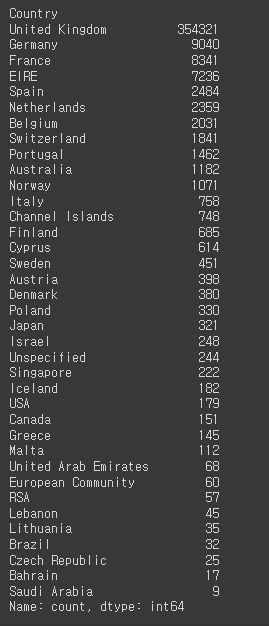
# 각 나라별 구매 횟수
# pd.options.display.max_info_rows = 50 # 데이터 다 안나올때 조절가능
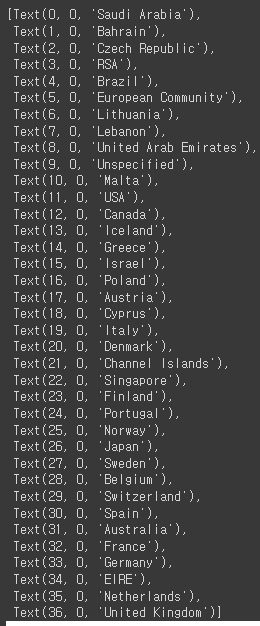
retail['Country'].value_counts()
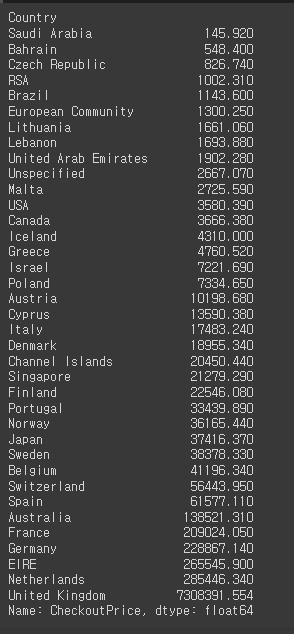
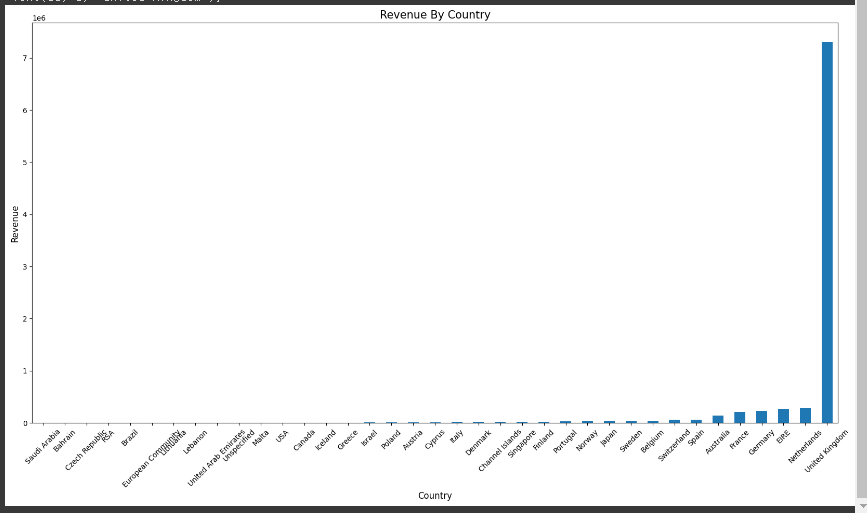
# 국가별 매출
rev_by_countries = retail.groupby('Country')['CheckoutPrice'].sum().sort_values()
rev_by_countries
# 국가별 매출에 따른 막대 그래프
plot = rev_by_countries.plot(kind='bar', figsize=(20, 10))
plot.set_xlabel('Country', fontsize=12)
plot.set_ylabel('Revenue', fontsize=12)
plot.set_title('Revenue By Country', fontsize=15)
plot.set_xticklabels(labels=rev_by_countries.index, rotation=45)
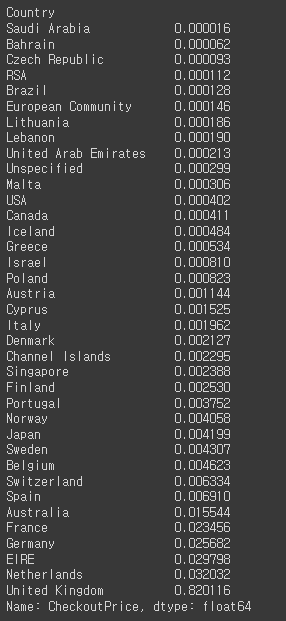
rev_by_countries / total_revenue
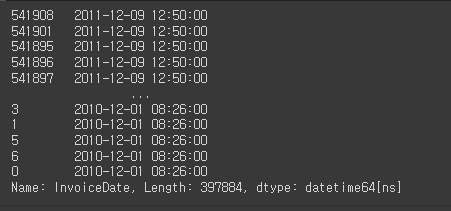
retail['InvoiceDate'].sort_values(ascending=False)
# 월별 매출 구하기
def extract_month(date): # 2011-12-09
month = str(date.month) # 12
if date.month < 10:
month = '0' + month # 예) 2월일 경우 02
return str(date.year) + month # 201112, 201101
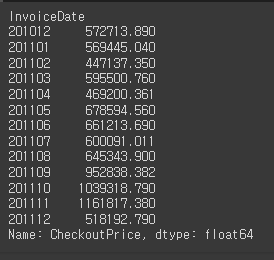
rev_by_month = retail.set_index('InvoiceDate').groupby(extract_month)['CheckoutPrice'].sum()
rev_by_month
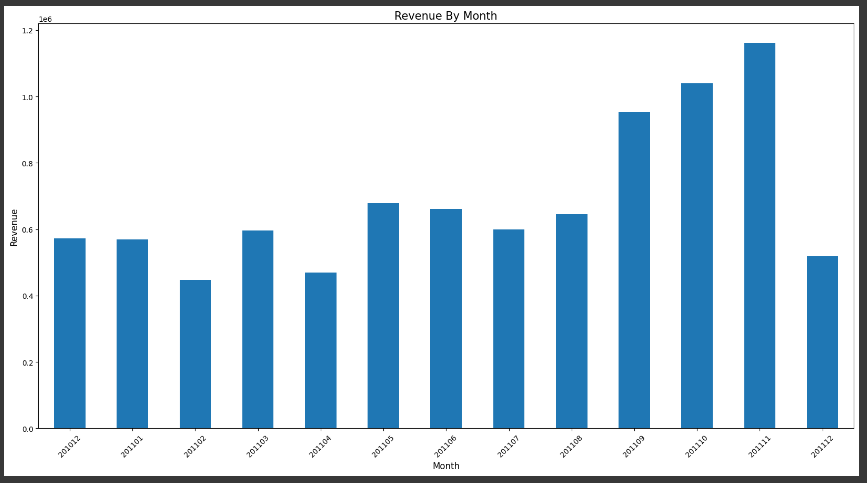
def plot_bar(df, xlabel, ylabel, tilte, titlesize=15, fontsize=12, rotation=45, figsize=(20, 10)):
plot = df.plot(kind='bar', figsize=figsize)
plot.set_xlabel(xlabel, fontsize=fontsize)
plot.set_ylabel(ylabel, fontsize=fontsize)
plot.set_title(tilte, fontsize=titlesize)
plot.set_xticklabels(labels=df.index, rotation=rotation)
plot_bar(rev_by_month, 'Month', 'Revenue', 'Revenue By Month')
# 요일별 매출 구하기
def extract_weekday(date):
return date.weekday()
# rev_by_dow = retail.set_index("InvoiceDate").groupby(extract_dow)["CheckoutPrice"].sum()
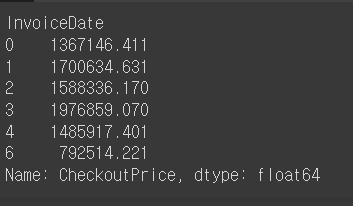
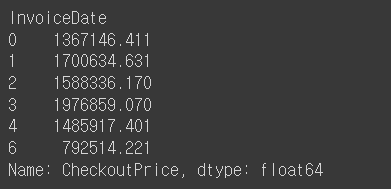
rev_by_dow = retail.set_index("InvoiceDate").groupby(lambda date: date.dayofweek)["CheckoutPrice"].sum()
rev_by_dow
rev_by_dow
import numpy as np
DAY_OF_WEEK = np.array(['Mon', 'Tue', 'Wed', 'Thur', 'Fri', 'Sat', 'Sun'])
rev_by_dow.index = DAY_OF_WEEK[rev_by_dow.index]
rev_by_dow
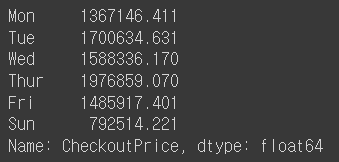
rev_by_dow

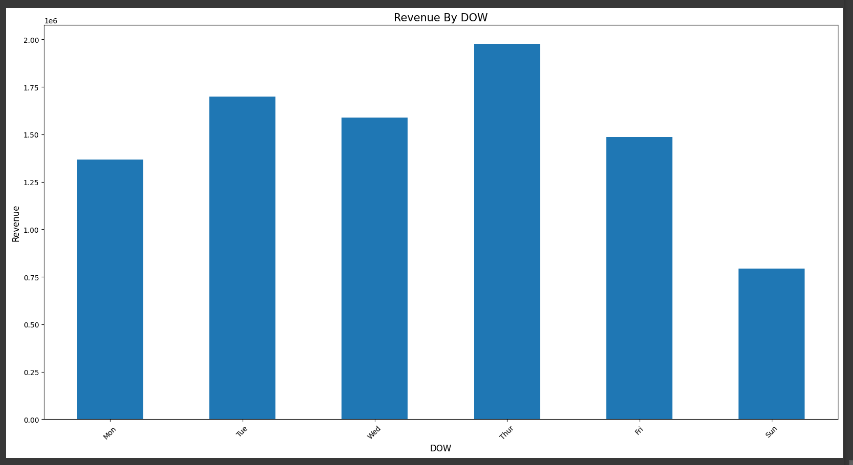
plot_bar(rev_by_dow, 'DOW', 'Revenue', 'Revenue By DOW')
# 시간대별 매출 구하기
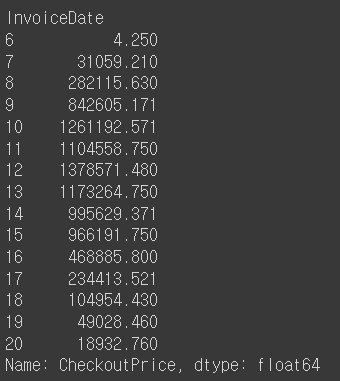
rev_by_hour = retail.set_index('InvoiceDate').groupby(lambda date: date.hour)['CheckoutPrice'].sum()
rev_by_hour
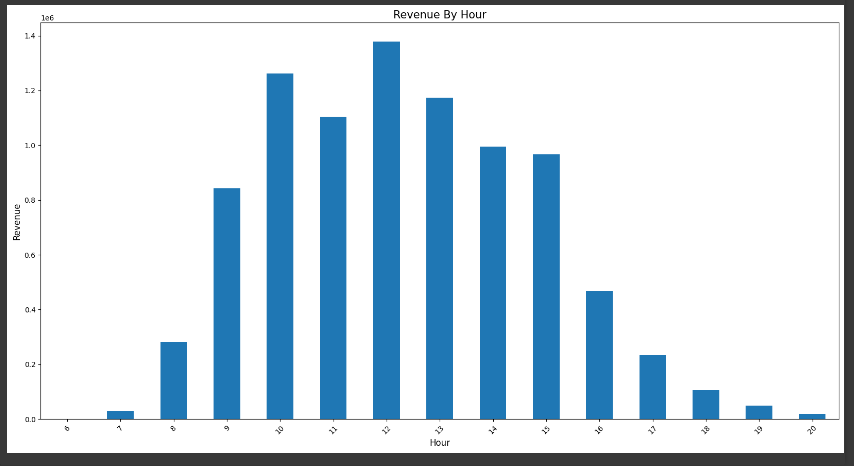
plot_bar(rev_by_hour, 'Hour', 'Revenue', 'Revenue By Hour')
데이터로부터 Insight
- 전체 매출의 약 82%가 UK에서 발생
- 매출은 꾸준히 성장하는 것으로 보임(11년 12월 데이터는 9일까지만 포함)
- 토오일은 영업을 하지 않음
- 새벽 6시에 오픈, 오후 9시에 마감이 예상
- 일주일 중 목요일까지는 성장세를 보이고 이후 하락
문제
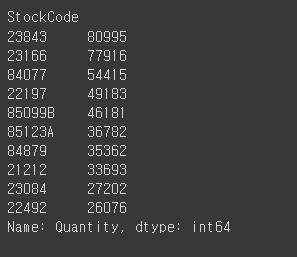
- 판매제품(StockCode) Top 10
- 단, 기준은 Quantity
'''
StockCode
23843 80995
23166 77916
84077 54415
22197 49183
85099B 46181
85123A 36782
84879 35362
21212 33693
23084 27202
22492 26076
'''

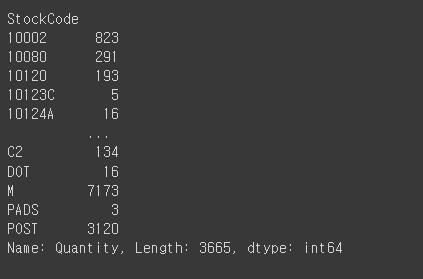
top_selling = retail.groupby('StockCode')['Quantity'].sum()
top_selling
# 'StockCode'별로 'Quantity'의 합계를 계산한 후, 합계가 큰 순서대로 정렬하여 상위 10개를 선택합니다.
top_selling = retail.groupby('StockCode')['Quantity'].sum().sort_values(ascending=False)[:10]
# 상위 10개의 판매 항목을 출력합니다 # head(10) 또는 [:10] => 10개만 출력
top_selling
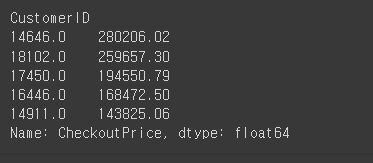
문제
- 우수 고객(Customer ID) Top 10
- 단, 기준은 CheckoutPrice
'''
CustomerID
14646.0 280206.02
18102.0 259657.30
17450.0 194550.79
16446.0 168472.50
14911.0 143825.06
12415.0 124914.53
14156.0 117379.63
17511.0 91062.38
16029.0 81024.84
12346.0 77183.60
'''

# 오류뜸
vvip = retail.groupby('CustomerID')['CheckoutPrice'].sum().sort_values(ascending=False)[:10]
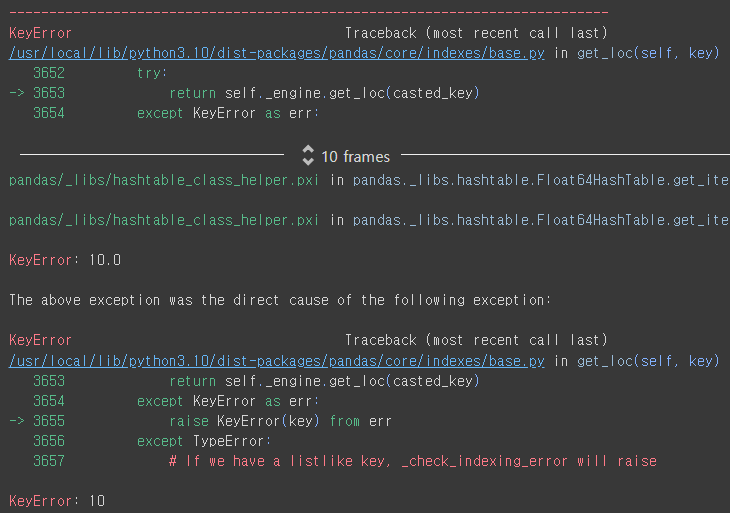
vvip = retail.groupby('CustomerID')['CheckoutPrice'].sum().sort_values(ascending=False).head()
vvip
'Python > 데이터분석' 카테고리의 다른 글
| 2024-05-28 6. 전국 도시공원 데이터 (0) | 2024.05.30 |
|---|---|
| 2024-05-28 상권별 업종 밀집 통계 데이터 (0) | 2024.05.30 |
| 2024-05-27 Matplotlib (0) | 2024.05.27 |
| 2024-05-24 판다스 (0) | 2024.05.24 |
| 2024-05-23 판다스 (0) | 2024.05.23 |